2D PROGRAMSExcellence (6 points): Complete PurellPlease, HertzDonut, and BestWorstCase within 50 hours. All coding standards are demonstrated throughout all programs.
Advanced (5 points): Complete PurellPlease and HertzDonut within 50 hours, and have BestWorstCase completed by the end of Cycle 2. All coding standards are demonstrated throughout all programs. Proficient (4 points): Complete PurellPlease and HertzDonut by the end of Cycle 2. All coding standards are demonstrated throughout all programs. Basic (3 points): Complete PurellPlease by the end of Cycle 2, and have HertzDonut finished but not functioning. Below Basic (2 points): Complete PurellPlease by the end of Cycle 2. |
|
THIS MODULE'S ALBUMS:Oasis: (What's The Story) Morning Glory (1995)
Dire Straits: Brothers in Arms (1985) |

|

|
PurellPlease
Write a program to give you the number of germs in an epidemic. The user should input how many germs were present to begin with and the rate (as a percentage, not a decimal) with which they are growing by the hour. It should output how many germs there would be in each of the next three hours, rounded to the nearest germ.
TEST DATA #1: 64 germs growing at a rate of 45% an hour:
Hour 1: 93 germs
Hour 2: 135 germs
Hour 3: 195 germs
TEST DATA #2: 8000000000000 (8 trillion) germs decaying at a rate of 99.97% an hour (the claimed effectiveness % of some disinfectants; this would simulate applying it three times over three hours).
Hour 1: 2400000000 germs
Hour 2: 720000 germs
Hour 3: 216 germs
HertzDonut
Your specialty bakery HertzDonut sells brewed coffee (none of the fancy stuff) and glazed donuts. A coffee costs $1.49. A glazed donut costs $0.79 or $4.25 for six (half-dozen). Note: Ordering more than six donuts automatically gives the customer the half-dozen pricing, even if he/she does not ask for that pricing.
Write a user-friendly program that asks the user how many coffees and how many donuts he/she wishes to order. Follow that by asking if the user would like to leave a tip and, if so, what percentage of the subtotal (the coffee/donut cost) the tip should be. Expect the user to enter a whole percentage, like 15, instead of the decimal form (0.15).
Calculate the total cost of the order, then apply 6% tax to the donut/coffee costs (but NOT the tip). Likewise, the tip is calculated before tax.
Output a receipt that includes the following:
Test Data:
Inputs:
#1: 6 coffees, 15 donuts, 10% tip
#2: 1 coffee, 2 donuts, 20% tip
#3: 27 coffees, 84 donuts, 12% tip
Outputs:
Your specialty bakery HertzDonut sells brewed coffee (none of the fancy stuff) and glazed donuts. A coffee costs $1.49. A glazed donut costs $0.79 or $4.25 for six (half-dozen). Note: Ordering more than six donuts automatically gives the customer the half-dozen pricing, even if he/she does not ask for that pricing.
Write a user-friendly program that asks the user how many coffees and how many donuts he/she wishes to order. Follow that by asking if the user would like to leave a tip and, if so, what percentage of the subtotal (the coffee/donut cost) the tip should be. Expect the user to enter a whole percentage, like 15, instead of the decimal form (0.15).
Calculate the total cost of the order, then apply 6% tax to the donut/coffee costs (but NOT the tip). Likewise, the tip is calculated before tax.
Output a receipt that includes the following:
- A company header/message.
- A three column 'table' that includes label, quantity, and cost for each of the following:
- Coffee
- Donuts
- Donuts HD (HD stands for half-dozen)
- Subtotal
- Tax
- Tip
- Total (Subtotal, Tax, and Tip)
- NOTE: All of the dollar amounts should line up by their decimal points. This should work just fine if you use a right-aligned table!
- A thank you message.
Test Data:
Inputs:
#1: 6 coffees, 15 donuts, 10% tip
#2: 1 coffee, 2 donuts, 20% tip
#3: 27 coffees, 84 donuts, 12% tip
Outputs:
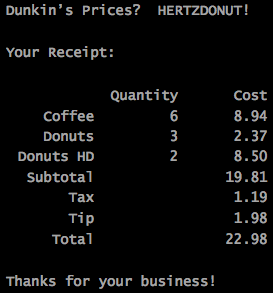
Outputs for Test Data Input Set #1
|
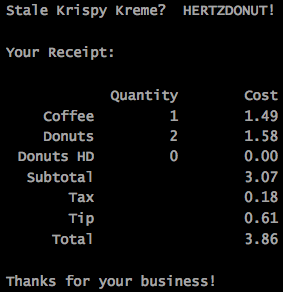
Outputs for Test Data Input Set #2. NOTE: $3.87 is acceptable for the total.
|
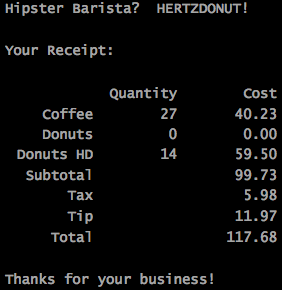
Outputs for Test Data Input Set #3
|
BestWorstCase
The Lancaster County Planning Commission recently published projections for populations in all of its municipalities through the year 2040 based on 2010 census data. The report acknowledges that the projections should fall within a 3% margin of error, meaning that the rate of change should fall within 3% either way of the estimated rate.
As a member of the planning commission, you have been asked to create a program to create a table of data for a single municipality. This table will ultimately include the minimum, projected, and maximum population in the years 2015, 2020, and 2025 for that municipality. The inputs would be the name of the municipality, the population in 2010, and the expected rate of growth or decay over each five year period.
Several calculations will need to occur behind the scenes. You will need to calculate the projected populations in 2015, 2020, and 2025 based on the exact rate of growth or decay specified by the user. In addition, you will need to calculate the minimum and maximum populations in those three years based on the margin of error of 3%. For example, if 1% growth is expected, then the minimum would be 2% decay (-2%) and the maximum would be 4% growth.
Your output should be a right aligned table including the name of the municipality (in the upper left) and a column for the years 2010, 2015, 2020, and 2025. The three rows of the table should hold the minimum, projected, and maximum values of the populations for each of those years (except 2010--that would just have the original population in the "projected" row).
TEST DATA (note that your output must be in a right-aligned table!):
Elizabethtown Borough: 2010 population of 11545, expected 5-year growth rate of 3.3%
Minimum populations:
2015: 11580
2020: 11614
2025: 11649
Projected populations:
2015: 11926
2020: 12320
2025: 12726
Maximum populations:
2015: 12272
2020: 13045
2025: 13867
---------------------------------
Marietta Borough: 2010 population of 2588, expected 5-year decay rate of 0.6% (-0.6%)
Minimum populations:
2015: 2495
2020: 2405
2025: 2318
Projected populations:
2015: 2572
2020: 2557
2025: 2542
Maximum populations:
2015: 2650
2020: 2714
2025: 2779
---------------------------------
Mount Joy Township: 2010 population of 9873, expected 5-year growth rate of 6.4%
Minimum populations:
2015: 10209
2020: 10556
2025: 10915
Projected Populations:
2015: 10505
2020: 11177
2025: 11892
Maximum populations:
2015: 10801
2020: 11816
2025: 12927
ABC: CDCompare (+2)
A bank offers two types of certificates of deposit to its users. Both CD’s will use the same APR (annual percentage rate), better known as the interest rate.
The Fast Saver CD offers monthly compounding in 1, 2, or 3 year terms. There is a $15 fee taken off this CD at the end of the investment period.
In monthly compounding, the interest is added to the account at the end of every month. However, the amount of increase is only 1/12th of the actual rate.
For example, an investment with a 12% APR (annual percentage rate) that compounds monthly would get a 1% interest applied every month.
Example: $1000 with 12% APR compounded monthly that began on January 1. Here, 1/12th of the APR is 1%.
The No Fee CD offers yearly compounding in 1, 2, or 3 year terms. As you can guess, there is no fee taken off this CD at the end.
In yearly compounding, the full APR is applied at the conclusion of each year.
Example: $1000 with 12% APR compounded monthly that began on January 1.
Your program should allow the user to put in an amount of principal (the starting cash amount of the CD) and the APR (as a decimal).
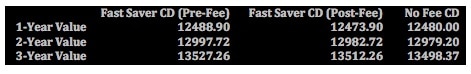
After all calculations, the program should output a right-aligned table which looks like the one shown below, which includes valid test data for an initial investment of $12000 with an APR of 4%.
A bank offers two types of certificates of deposit to its users. Both CD’s will use the same APR (annual percentage rate), better known as the interest rate.
The Fast Saver CD offers monthly compounding in 1, 2, or 3 year terms. There is a $15 fee taken off this CD at the end of the investment period.
In monthly compounding, the interest is added to the account at the end of every month. However, the amount of increase is only 1/12th of the actual rate.
For example, an investment with a 12% APR (annual percentage rate) that compounds monthly would get a 1% interest applied every month.
Example: $1000 with 12% APR compounded monthly that began on January 1. Here, 1/12th of the APR is 1%.
- On February 1, the account would be $1000 * 1.01 = $1010.00
- On March 1, the account would be $1010 * 1.01 = $1021.10
- As this pattern continues, the account would be at $1126.83 on January 1 of the following year, but in this Fast Saver CD a $15 charge is applied knocking it down to $1111.83.
The No Fee CD offers yearly compounding in 1, 2, or 3 year terms. As you can guess, there is no fee taken off this CD at the end.
In yearly compounding, the full APR is applied at the conclusion of each year.
Example: $1000 with 12% APR compounded monthly that began on January 1.
- On January 1 of the following year, the account would be at $1000 * 1.12 = $1120.
- The year after would be at $1120 * 1.12 = $1254.50.
Your program should allow the user to put in an amount of principal (the starting cash amount of the CD) and the APR (as a decimal).
After all calculations, the program should output a right-aligned table which looks like the one shown below, which includes valid test data for an initial investment of $12000 with an APR of 4%.