5D PROGRAMSExcellence (6 points): Complete MoleAndKing, TopStudent, and VoterData within 50 hours.
Advanced (5 points): Complete all three programs by the end of Cycle 5. Proficient (4 points): Complete any two programs by the end of Cycle 5. Basic (3 points): Complete one program by the end of Cycle 5, and have a second program incorrect or mostly complete. Below Basic (2 points): Complete one program by the end of cycle 5. |
|
THIS MODULE'S ALBUMS:Jackson Browne: Running On Empty (1977)
Cage The Elephant: Melophobia (2013) |

|

|
MoleAndKing
This program has no inputs. Generate one hundred random integers from 1-100000, store them in an array of longints, and then output them in a 10x10 grid (10 per line, field width 8). Find the largest number (king) and smallest number (mole) in the array and output them.
This program has no inputs. Generate one hundred random integers from 1-100000, store them in an array of longints, and then output them in a 10x10 grid (10 per line, field width 8). Find the largest number (king) and smallest number (mole) in the array and output them.
TopStudent
The goal of this program is simple: a teacher enters the names of the students in her class, then inputs the grades for those students on three assignments named Homework (worth 10 points), Quiz (worth 25 points) and Exam (worth 100 points). Each student's average is calculated. A right-aligned table is output which lists the students in order from top average to bottom average with the percentage being rounded to the nearest whole number.
TEST DATA:
Teacher inputs the following names.
Aaron
Bev
Carl
Dora
Here are the grades for the kids.
Homework
Aaron = 9
Bev = 8
Carl = 7
Dora = 6
Quiz
Aaron = 23
Bev = 15
Carl = 24
Dora = 22
Exam
Aaron = 85
Bev = 82
Carl = 92
Dora = 100
Here's the output (but yours should be right-aligned):
Dora 6 22 100 95%
Carl 7 24 92 91%
Aaron 9 23 85 87%
Bev 8 15 82 78%
ElectoralPlay
The 2024 Presidential Election is coming up. As a political analyst, your job is to provide data to decide which states to campaign in and advise the travel planner on what is coming next.
Write a program to compare data in multiple states. The user begins by choosing how many states she wishes to compare. Then, give the user a place to enter the following sources of data for each state (in this order):
1) The state's name
2) How many electoral votes does that state receive?
3) What % of the popular vote did your party's candidate receive in 2020?
4) What % of the popular vote did the opposing party's candidate receive in 2020?
After the data is entered for each state, calculate an "Importance Score" for the state. That score is calculated by multiplying the electoral votes by "one-hundred minus the absolute value of the difference of the percentages from 2020". For example, North Carolina has 15 electoral votes, and suppose 50.39% of which went to the Republican, and 48.35% of which went to the Democrat and . So, the Importance Score for North Carolina is:
15*(100 - |50.39 - 48.35|)
15*(100 - 2.04)
15*(97.96)
Score = 1469.40
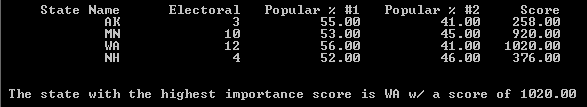
Your output should include a right-aligned table with a column for each of the four inputs above and the Importance Score in the fifth column. Finally, the program should determine the state with the highest importance score and tell the user this on the final line.
TEST DATA: 4 states...
The 2024 Presidential Election is coming up. As a political analyst, your job is to provide data to decide which states to campaign in and advise the travel planner on what is coming next.
Write a program to compare data in multiple states. The user begins by choosing how many states she wishes to compare. Then, give the user a place to enter the following sources of data for each state (in this order):
1) The state's name
2) How many electoral votes does that state receive?
3) What % of the popular vote did your party's candidate receive in 2020?
4) What % of the popular vote did the opposing party's candidate receive in 2020?
After the data is entered for each state, calculate an "Importance Score" for the state. That score is calculated by multiplying the electoral votes by "one-hundred minus the absolute value of the difference of the percentages from 2020". For example, North Carolina has 15 electoral votes, and suppose 50.39% of which went to the Republican, and 48.35% of which went to the Democrat and . So, the Importance Score for North Carolina is:
15*(100 - |50.39 - 48.35|)
15*(100 - 2.04)
15*(97.96)
Score = 1469.40
Your output should include a right-aligned table with a column for each of the four inputs above and the Importance Score in the fifth column. Finally, the program should determine the state with the highest importance score and tell the user this on the final line.
TEST DATA: 4 states...